Under Statistics in the sidebar you can see how things are going: how much you're selling, how full you are and where your bookings come from. Everything is calculated from your own bookings and updated continuously. Statistics are included in every plan.
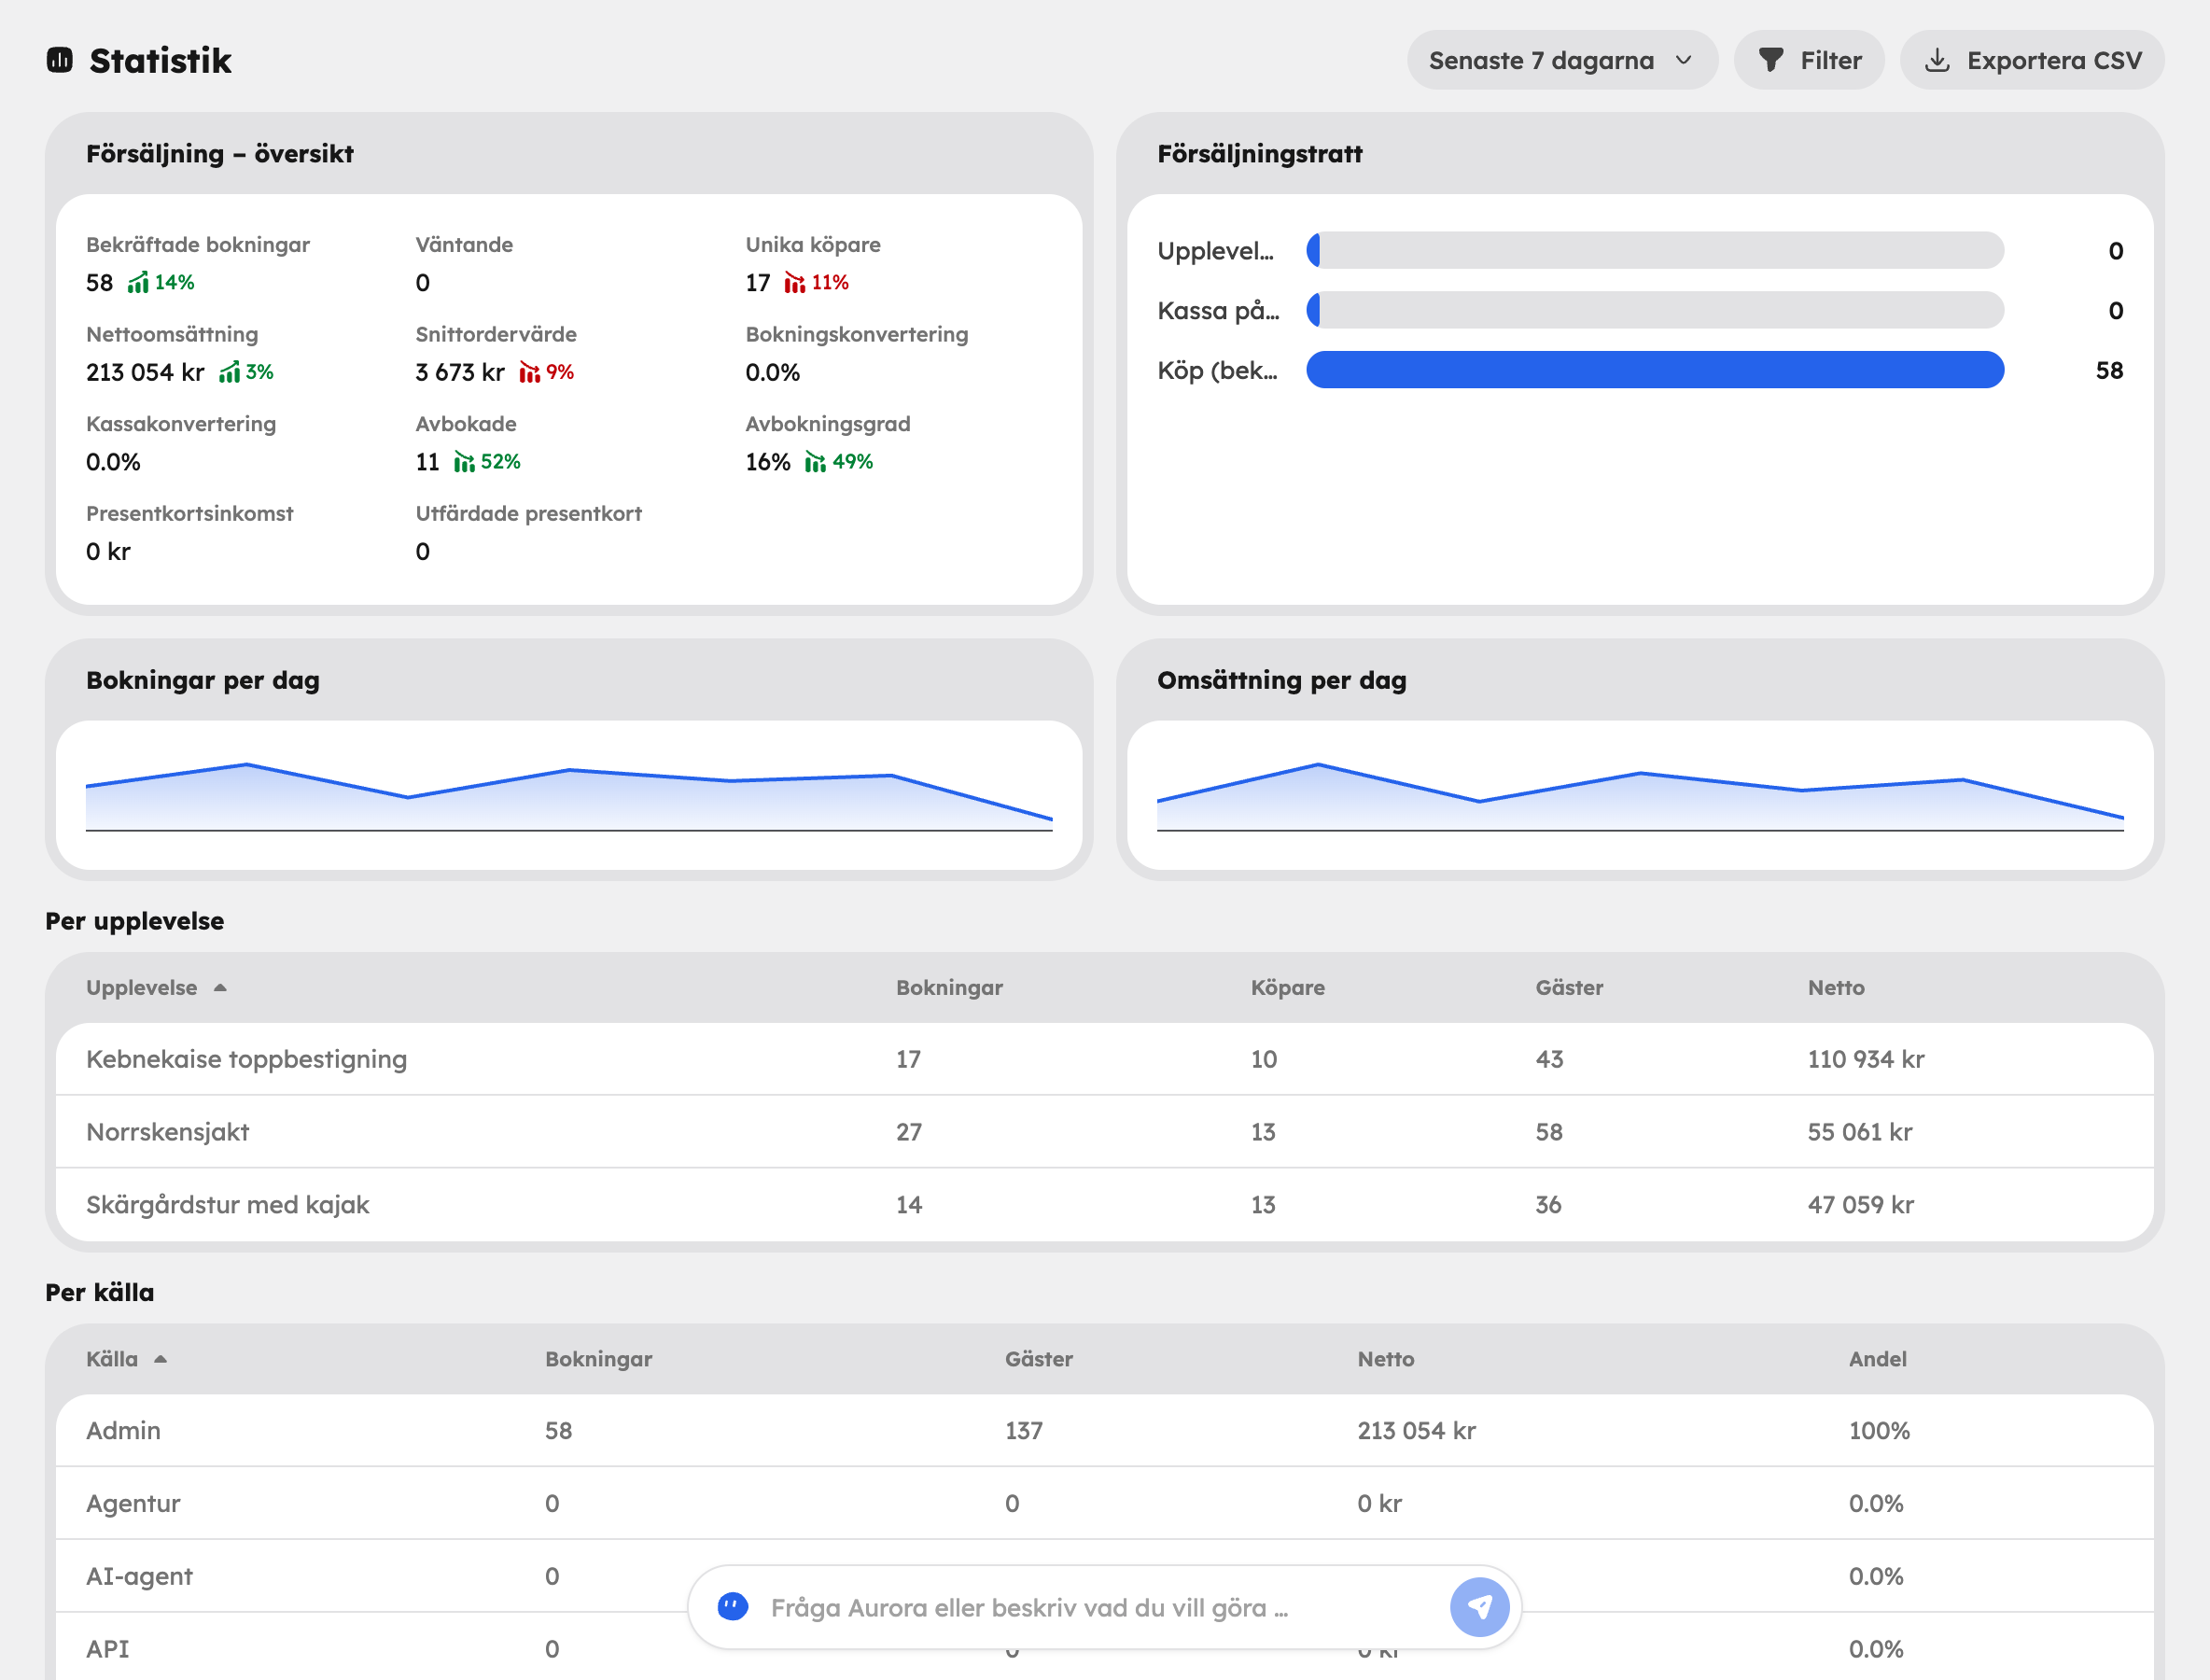
Choose period and selection#
- Period — choose from Preset periods (Today, Yesterday, Last 7 days, Last 30 days, This month, This year), or switch to Custom period and choose the start and end dates yourself.
- Sold or completed — in the filter, choose what the date should mean:
- Sold counts bookings by when they were made. Good for following sales.
- Completed counts by when the tour runs. Good for seeing what you actually run and earn in a given period.
- Filter — limit to certain Experiences or a particular Source: Online, Admin, Agency, AI agent or API.
Key figures#
Under Sales — overview you'll find:
| Key figure | What it shows |
|---|---|
| Confirmed bookings | Bookings that are complete. |
| Pending | Bookings that aren't confirmed yet, for example unpaid ones. |
| Unique buyers | How many different people have booked. |
| Net revenue | Net sales for the period. |
| Average order value | Average amount per booking. |
| Booking conversion | The share of views of an experience that turned into a booking. |
| Checkout conversion | The share of those who started checkout who went on to book. |
| Guests | Total number of guests. |
| Occupancy | The share of places that are sold. Shown when you've chosen Completed. |
| Cancelled and cancellation rate | How many bookings, and what share, have been cancelled. |
| Gift card income and gift cards issued | Sales of gift cards. Shown when the Gift cards app is switched on. |
Deeper analysis#
- Sales funnel — from experience view to started checkout and purchase. Here you can see where visitors drop off. The funnel isn't shown when you filter on a source.
- Bookings per day and Revenue per day — charts across the period.
- By experience — which experiences sell best and have the highest occupancy.
- By source — how much comes from the shop, the admin, resellers, AI agents and the API.
- New and returning — how many buyers are new and how much the returning ones account for.
- Discount leakage — how much of the sales value has gone on discount codes.
- Booking window — how far in advance guests usually book.
- By weekday — which days sell and fill up best.
- By departure — bookings, guests, occupancy and net for each individual departure.
If most people book only a few days in advance, it's late to market a departure the week before. If they book months in advance, it may be worth opening more departures early.
Export#
Click Export CSV to download the statistics for the selected period and selection, for example to work with them further in a spreadsheet or send them to your accountant.
Bookings, customers, experiences, discounts and gift cards can also be exported from their own lists. If you need a summary in a different form, you can ask Aurora, the AI assistant, to make a report as a PDF.
Good to know#
- Bookings that were paid in a previous booking system and moved here are included in revenue. Their source is Admin.
- You can see payouts and fees from Stripe under Finance in the sidebar. See Payments.
- You can follow sales via AI services in detail on the page for the AI sales channel.